
Introduction
It’s no secret that organizations in the construction, power grid, oil and gas, and power generation sectors are asset-intensive. They depend heavily on the performance of their assets to drive their business units efficiently. When you couple aging facilities and infrastructure with a challenging economic climate, companies have no choice but to make efficiency enhancements to maintain competitiveness in the market and system reliability for their customers.
There is no denying that in today’s competitive landscape, every asset-intensive company should make the most of the proliferation of big data, sensors, and analytical techniques, along with the latest advancements in reality modeling, asset performance modeling, and 3D visual operations.
With drone technology improving rapidly and organizations in the construction and energy sectors adopting the technology to replace traditional methods of collecting large volumes of visual data, it has become more critical than ever to understand the best way to manage the data collected by drones. In short, it’s all about the data!
Benefits of Using Drones
To collect all of this data, unmanned aerial vehicles (UAS), also known as a drones, have graduated from proof-of-concept phase into full industry adoption. Professional unmanned aircraft operation typically consists of a pilot and a payload operator, a drone, and an effective communication system between the two.
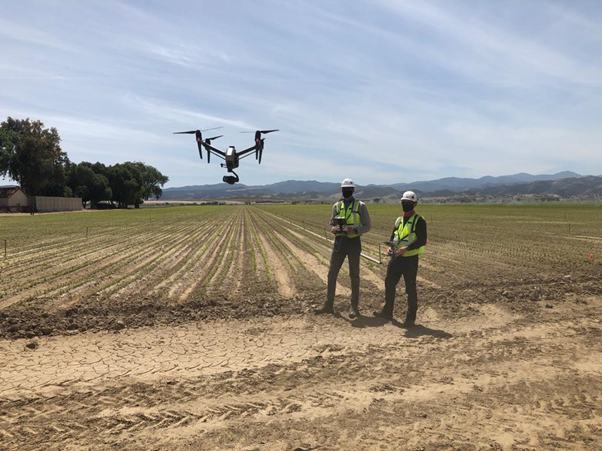
Recent advances have allowed for the design and development of many different types of sophisticated unmanned aerial vehicles, used for various purposes, including planning complex inspection campaigns. The reason unmanned aerial vehicles are being adopted so readily and quickly in the construction and energy sector is that their efficient, fast, and safe nature make good business sense. We’re now testing single-person inspection operations that will make data collection faster and much more scalable, even competing with the speed of helicopters in some areas.
What is Visual Data?
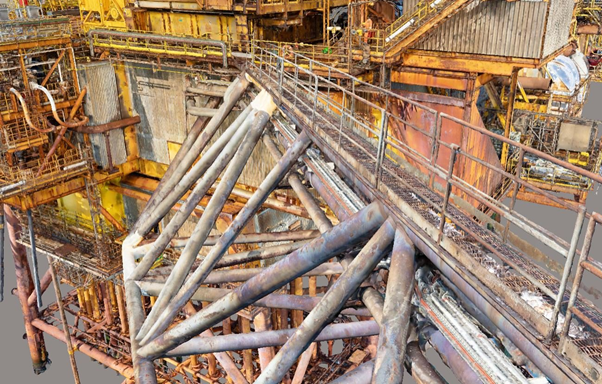
Visual data is data which displays evidence of a situation. Normally in the form of a photo or video, visual data allows the view to examine the state of a physical object. Additionally, visual data can be viewed as an integral approach to combining visualization, data analysis, and human factors.

Like any industrial data set, storing visual data collected by drones takes enormous processing and storage capacities to gain valuable insights and solve complex problems. Furthermore, managing, layering, and making sense of visual drone-captured data can pose a challenge. Remember, drones are only tools. The value for energy companies is in the data that enables them to make evidence-based decisions.
It is worth noting that visual data management methods in the construction and energy sectors allow key decision-makers to combine their human creativity and collaborate easily.
For example, without leveraging powerful visual data management tools and software to identify asset defects…engineers, asset owners, and inspection managers struggle to stay on schedule and avoid unplanned downtime in the field. Visual data collected by drones provides a solution for these problems and, by doing so, increases efficiency and reduces resource costs.
Managing Drone Data
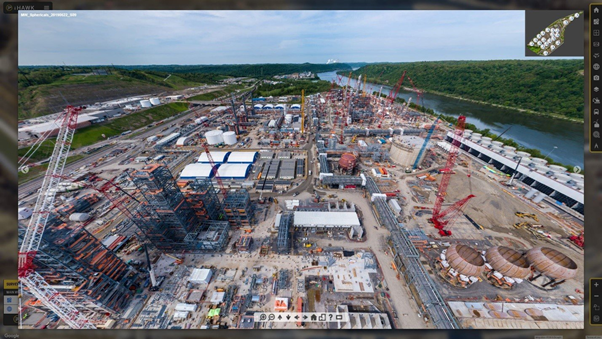
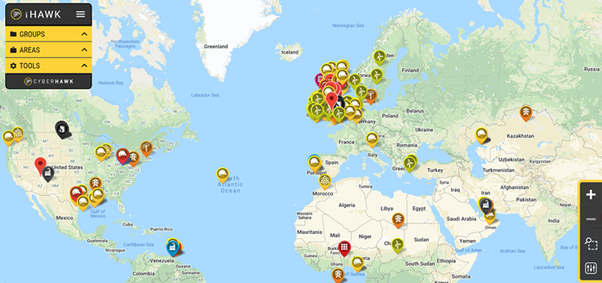
Often, the sheer volume of data generated in the energy sector is overwhelming. There is simply too much data and too little time and human resources to assess and process it. Furthermore, some visual data is not accessible to the relevant stakeholder or at their disposal in some cases. However, there is a quick and effective solution; this is where visual data management platforms such as iHawk come into the picture. Visual data analysis in the energy sectors helps energy providers make sense of it by seamlessly combining data visualization and data analytics techniques to create a multi-layered single source of truth that can be accessed throughout an organization.
By combining drone data collection and visualization software, companies can create a single source of truth across all their industrial assets. These organizations often partner with asset inspection management specialists like Cyberhawk to monitor critical assets and track usage, age, and health. They can also keep an eye on and compare maintenance history and a slew of other decision-influencing variables.
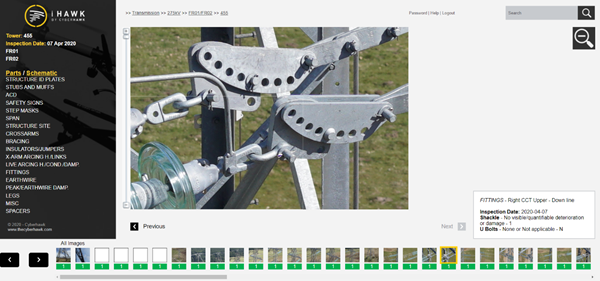
For example, advanced analytics, reliable asset management software, and big data help transmission and distribution operators lower their asset-management costs, improve performance, and capture more value. Notably, visual data management systems like iHawk, help engineers, asset owners, and integrity managers keep track of their vast pools of visual data and help organize data in one easy to navigate and quick to access location.
Conclusion
With the emergence of high-value visual data captured by drones and an abundance of efficient storage solutions, it is now possible for construction and energy companies to scale their visual data programs to the enterprise level.
Cyberhawk, world-leaders in unmanned aerial vehicle (drone) asset inspection, offers end-to-end drone-based inspection and visual data management for power generation (such as nuclear power plants, solar and wind farms), oil and gas (such as flare stacks, FPSO, underdecks, and cooling towers), power grid (such as transmission, distribution, overhead lines, and substation) and construction sites (such as capital projects).